
Forget the MLB playoffs or The Bachelorette. The biggest competition in the US is The Great Amazon HQ2 Sweepstakes. After increasing its revenue by $70 billion between 2010 and 2015, starting the ‘smart speaker’ category, and buying Whole Foods, Amazon decided that it’s time to branch out. Last month, the Seattle-based tech behemoth announced that they are seeking a location for a second headquarters to accommodate their rapid growth.
Cities across the country are all hands on deck in their efforts to entice Amazon. Tulsa, Oklahoma’s “mayor’s office has been converted to a war room.” Philadelphia’s famed Wharton Business School is tasked with pitching the city to Amazon. The mayor of Frisco has promised Amazon to build his city around the new corporate campus.
While some of these proposals may seem over the top, the prospect of bringing a reported 50,000 high-paying jobs to their area would excite any city official. However, don’t expect Amazon to pick a location solely based on a clever campaign. In fact, they are quite particular about desired characteristics for their new HQ.
We used the characteristics they laid out, along with modern data science techniques, to project Amazon’s most likely choice for their new HQ. Check it out:
Data Acquisition
With nearly 3000 cities in the United States, we first created a “short-list” of eligible cities. We narrowed down our list to 35 cities based upon two requirements in Amazon’s RFP:- Metropolitan population greater than a million.
- Proximity to an international airport with direct flights to DC, New York, San Francisco and Seattle.
The remaining eligible locations were:
Atlanta, Austin, Baltimore, Boston, Charlotte, Chicago, Cincinnati, Cleveland, Dallas, Denver, Detroit, Houston, Indianapolis, Kansas City, Las Vegas, Los Angeles, Miami, Milwaukee, Minneapolis, Nashville, New Orleans, New York, Orlando, Philadelphia, Phoenix, Portland Oregon, Raleigh, Sacramento, Salt Lake City, San Antonio, San Diego, San Francisco, St. Louis, Tampa Bay, Washington DC.
Next, we combed through Amazon’s specifications list to identify a collection of measurable features for the eligible cities. For each feature, we found a corresponding data set that we could use to complete our analysis. In all, nine of the criterion laid out by Amazon had workable data sets.
Feature |
Data Set |
Description |
|---|---|---|
Business Friendly Climate |
Grades characteristics like the cost of starting a small business, hiring workers, and amount of taxes and regulations. |
|
High Quality of Life |
U.S. News rankings of the best places to live in America. |
|
Educated Population |
Percentage of population with a Bachelor’s Degree or higher. |
|
Robust mass transit system |
Measures the quality of a region’s public transit. | |
Optimal Fiber Optic Connectivity |
Percentage of a region that has access to fiber optic internet. |
|
Optimal Mobile Coverage |
Measures strength of cell phone networks and coverage. |
|
Strong University System |
Number of top-ranked universities and research facilities in a region. |
|
Diverse Population |
Level of socioeconomic, cultural, and economic diversity |
|
Within 30 miles to population center |
Measures how spread out a municipality is. The less sprawling, the more likely a city will meet this requirement. |
Analysis
To determine which city should win “Amazon’s Next Top Headquarters,” we decided to employ a popular data science method called recommendation systems. For example, this technique helps Netflix suggest new shows to watch and Amazon recommend new things to buy.
First, we standardized our data. This is a common technique in data science to shape different data onto the same scale. Standardization resulted in the creation of a new dataset where the mean of every feature is 0 and the standard deviation is 1. Utilizing the maximum values from each of the features, we first created a (fictional) best possible city.Next we calculated a similarity score between every real city in our data set and this fictional city. The closer the real cities features were to those of the fictional city, the better suitor it was for the HQ competition. We derived the similarity scores by calculating the euclidean distance between the fictional city and every real city in our dataset.
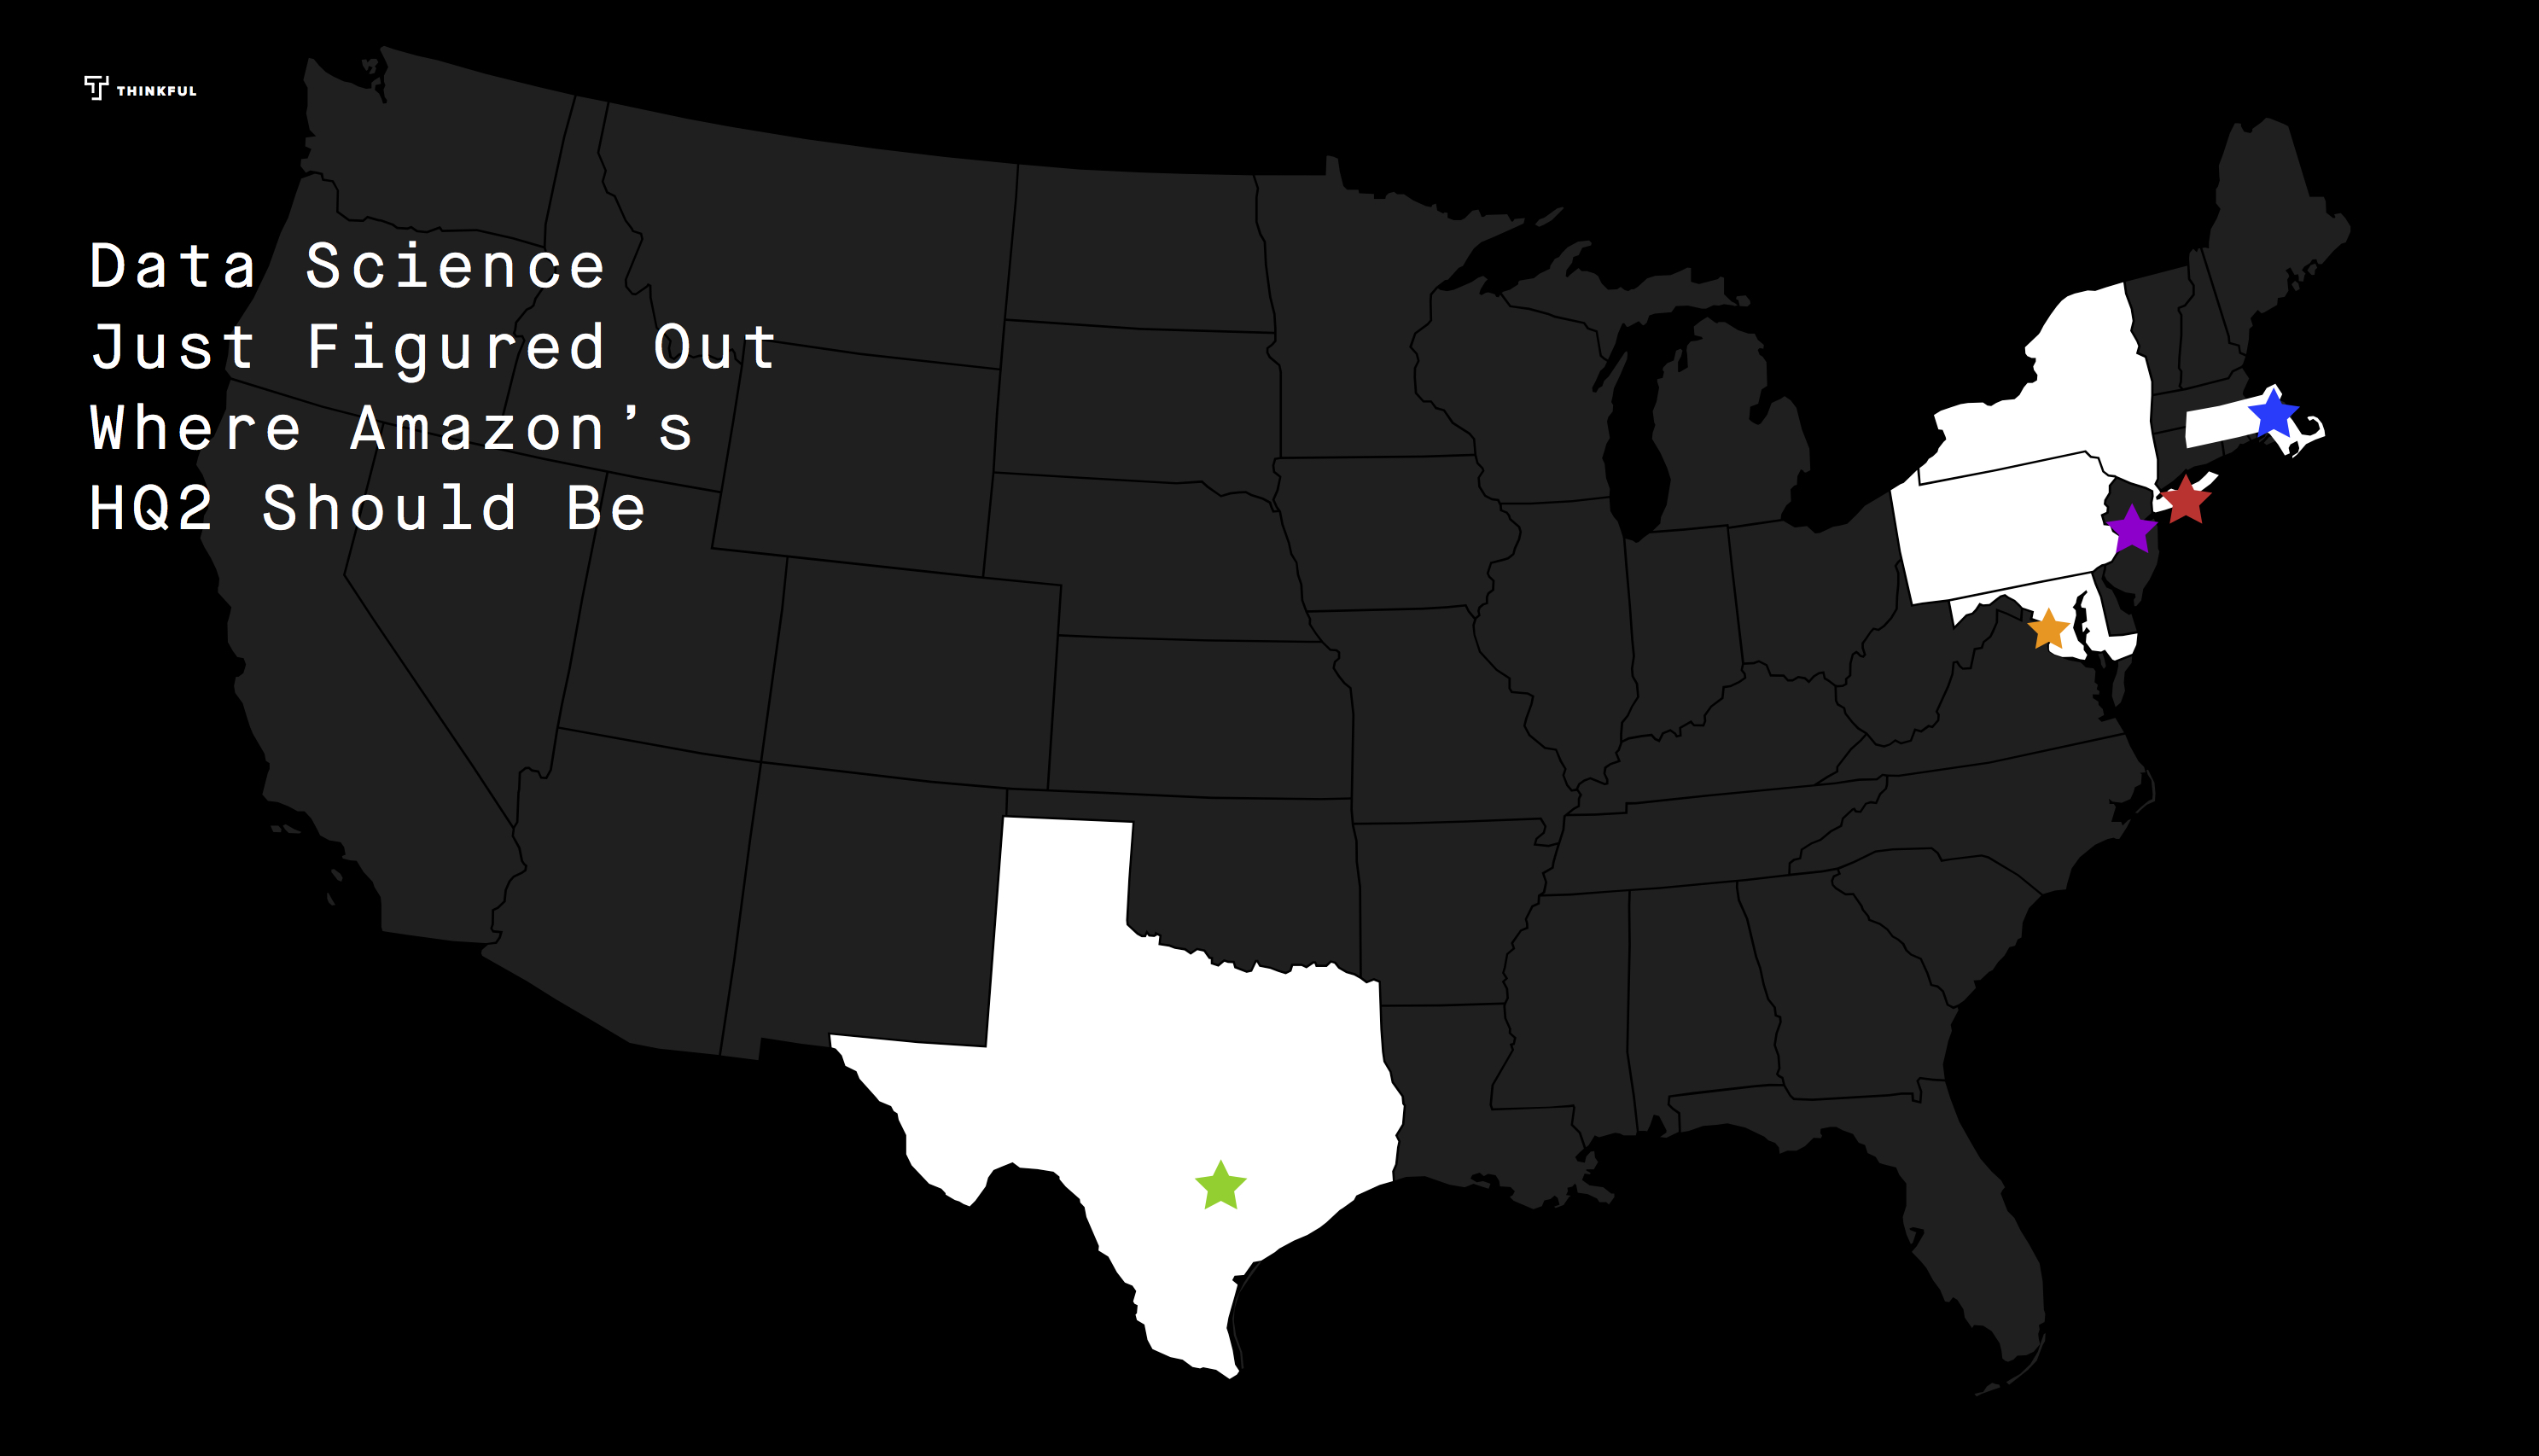
Our analysis determined the best city for Amazon’s HQ2 is…
Washington DC
Like Washington DC’s mayor’s office, data science says that Amazon’s best choice is #obviouslyDC. The Washington DC area possesses many qualities that Amazon is looking for in its ideal location including a highly educated population, an extensive transit system and a burgeoning reputation as a hip millennial town.
Compared to the other cities, Washington is:
- First in percent of population with a Bachelor’s Degree or higher.
- Third in life quality.
- Fourth in transit score.
- Ninth in diversity.
The four runner-ups are Boston, New York, Philadelphia, and Austin. One could say that the Acela corridor made an extremely strong showing in our analysis.
The complete rankings of all 35 cities on our “short-list” is presented below. The methods employed in this article are a small sample of the many data science and analysis skills taught in the Thinkful Data Science bootcamp. More information about this program and our DC coding bootcamp can be found on our site.

Cite Our Analysis
If you are interested in sharing our analysis on your site or publication, we would appreciate if you included the following attribution:
Study conducted by Thinkful's DC coding bootcamp
If you are interested in speaking with George McIntire or learning more about Thinkful, please email Robin, Thinkful's Head of Communications.