

Data Science is Making Astronomy Fun Again
I love space. It’s mysterious, intriguing, deadly, and quite literally limitless. But, when I was studying astronomy at the University of Colorado, I watched some of my colleagues’ fascination with space transform tragically into a sense of boredom and monotony. How could this happen?
Crater Counting
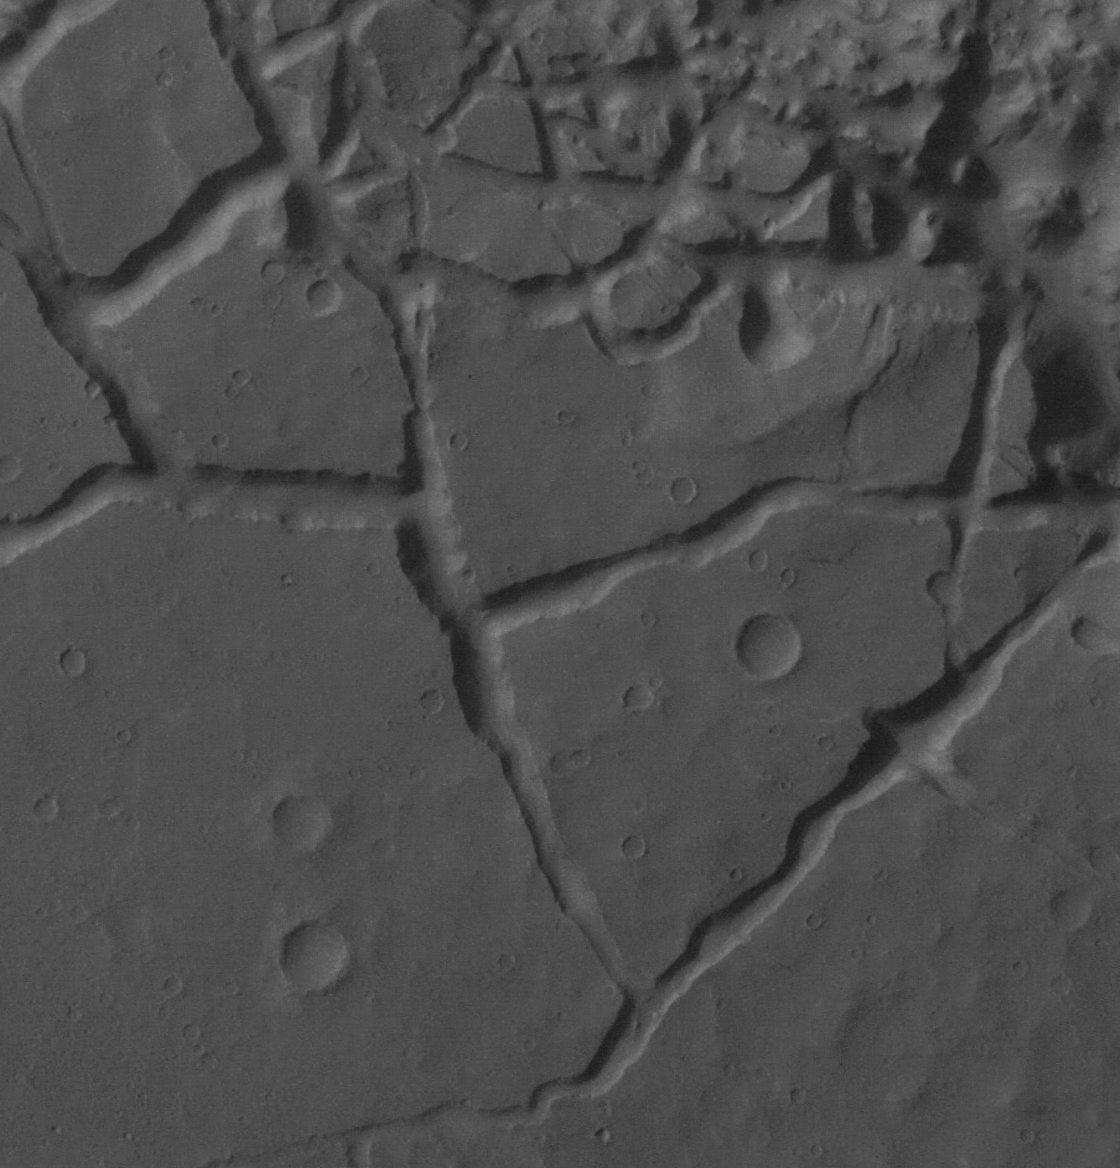
Counting craters is a rite of passage for planetary scientists. Imagine taking a fascinating image of the Martian surface like the one pictured and spending hours labeling and measuring every single crater in it. Boring.
And yet, since the first high-resolution images of the lunar surface have been available, this has been the repetitive work of planetary scientists.
Why Count Craters?
Why is it so important to know exactly the number, locations, and sizes of impact craters? For planetary geologists, these statistics are the best way to estimate the age of a surface. Think of this as a sort of “carbon dating” method for astronomers.
The theory behind this technique is the idea that impacts occur with some probability in the solar system. There is a huge number of small objects orbiting the sun, and a smaller amount of larger objects. Each of these objects can potentially impact a planet’s surface. Over time, astronomers expect the number of impacts with such objects to correlate with the amount of time a surface has existed; we can use the number and size of craters to measure the number of impacts that have occured and the size of the impactors.
Such information can also provide hints about the atmosphere of a planet or moon and its history. For example, take a look at these images of Mercury and Mars. Mercury, on the left, is full of craters. Craters on top of craters, inside of craters, and next to craters. Importantly, it has lots of tiny craters. Mars, on the right, has fewer impact craters and many of the craters are larger. This is a hint that, on Mars, an atmosphere is stopping small impacts from occuring. There are some small craters. The proportion of larger craters to smaller craters is a way to monitor the size of the Martian atmosphere over time; this result supports the theory that the tenuous Mars atmosphere was once more massive than it is today, and is shrinking over time. On Mercury, no such atmosphere exists to stop these impacts. This is why the size of the craters are as important as the number.

Crater Data
Astronomy is a science and science needs statistical evidence to supports its arguments. It’s not good enough to say “Mercury has more small craters.” We need to back that statement up with statistics, and for that we need to count craters. That’s how my classmates got stuck with this particular astronomy chore.
Automatic Crater Detection
Because of the labor-intensive nature of crater counting, the search for an automated crater detection algorithm (CDA) has been ongoing for decades. It turns out that this problem is pretty tough. Advances in machine learning, specifically with artificial neural networks, have enabled researchers to finally find ways to detect and measure craters with high reliability.
A Chance to Make a Difference
I joined the Thinkful Data Science program with an interest in improving my data-handling and python development skills. I was interested in applying data science to business and marketing problems.
During the course, I developed a fascination with machine learning. It became sort of a calling. To graduate, I had to complete a capstone project. At this time, I remembered some of the crater detection research I heard about in college. I realized I had an opportunity to make a difference for astronomers. I could apply the skills I learned with Thinkful to develop a crater detection algorithm.
Guided by Research
As exciting as it sounds to build a crater detector from scratch, I knew from the beginning that this is a difficult problem that has baffled researchers for a long time. I had a deadline and just a few weeks to present my project. There was no time for trial and error.
Fortunately, recent research showed promising results with convolutional neural networks. I decided to reproduce the techniques used in various research papers and build a product that is easy for astronomers to use. The research was promising, but it was all entirely experimental up to this point. I set out to transform this research into a user-friendly product.
PyCDA
PyCDA is my crater detection package for Python. It applies convolutional neural networks to make automated crater detection accessible for astronomers who don’t normally work with machine learning. PyCDA uses a model pipeline that applies the detection models automatically to input images and outputs the locations and sizes of the craters in the input image. Using it only requires very basic knowledge of python syntax.
PyCDA uses three steps to perform detections. The first step does the bulk of the work, producing a heatmap version of the image. This model classifies each pixel of the input image as being a part of a crater (hot) or not (cold.) This model’s output on our example image from Mars looks like this:

You can see the way the craters on the left match up with “hot” splotches on the heatmap on the right. The output is noisy, as the model has to navigate features like valleys and cliffs on the Martian surface.
This model uses a “U-Net” convolutional neural network architecture, which was originally developed for medical imaging segmentation in a 2015 research paper. It was shown to be effective for crater detection in a paper published in 2018. To get this model to recognize craters, I used a technique called supervised learning, where we show the model what the “right answer” is for a given input image. For this, I used data available from previous crater detection projects.
After seeing many such examples, the model learns to tell craters apart from other objects and gives desired results.
This model has done its job, and now it’s time to turn these hotspots into a list of measured craters. To do this, PyCDA has two options. The first models craters as circles, using the number of pixels in a splotch to calculate its diameter. It works pretty well.

When craters overlap, this model can cause problems. Here’s an example:

In this case, the touching craters cause the model to detect one big crater where there are actually three. To overcome this issue, I added an alternative to PyCDA using a fancier image processing technique known as “watershed segmentation.”

This algorithm does a better job in this case. It does tend to produce a higher number of detections, so the best model depends on the apparent crater density that the user is working with. Astronomers are advised to try both models, an option that can be specified when using PyCDA.
As a final step, PyCDA applies a binary classifier to each detected crater. This classifier simply says “this is a crater” or “this is not a crater” given an input image. PyCDA goes through the trouble of cropping each detected crater from the input image and feeding it to the classifier. This final step improves the overall performance of the model, helping filter out any false detections from the previous models.
The end result is a data file in csv format, which lists each of the detected craters, their locations on the input image, and their measured sizes. As a visual aid, PyCDA can produce an image overlaying its detections.
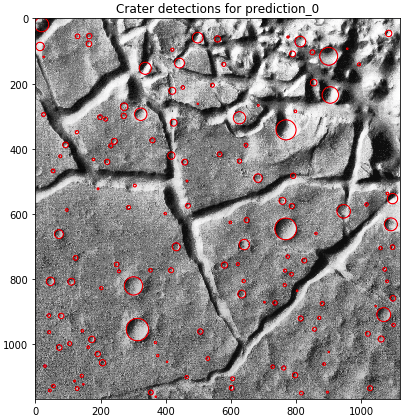
This is helpful because, well, the pipeline is not perfect. PyCDA makes mistakes, and it’s best to check its outputs. This means that a researcher still needs to participate, but a single person with the help of this algorithm can catalog far more craters in a day than before.
For the purposes of completing my capstone project, I was able to develop and release an alpha version of this software. There’s a lot of future work in improving it, but having that deadline allowed me to deliver a minimum working product in a remarkably short time. It’s something I wish I could have done back then for my classmates to get them through those long, boring days spent counting craters.
It feels good to use data science to make astronomy fun again!
Learning Data Science with Thinkful
Artificial intelligence-enabled tools improve productivity and performance in many applications, and astronomy is no exception. One amazing example is a project by Google researchers that discovered new planets orbiting nearby stars by applying neural networks to Kepler data.
When I studied astronomy, I recognized the importance of big data techniques in the field, but felt underprepared to deal with large volumes of data “in the wild.”
Thinkful presented a unique opportunity for me to expand on my data analysis skills and helped me discover my passion for machine learning. My journey from an enthusiast to machine learning engineer took a lot of self-guided research, but the Thinkful platform gave me the resources to grow and use my time effectively. I especially appreciated my mentor, Matt, who was an invaluable resource throughout the program. He offered a unique perspective, coming from a professional background as a data scientist working in finance, which helped me build a more broad and general understanding of data, analytics, and machine learning models.
Without the Thinkful program, I would not have been able to build PyCDA. The emphasis on delivering working models drove me to progress much faster than I was able to on my own. I’m proud of the work I did at Thinkful, and I’m looking forward to tackling new and exciting projects in the future.